Query Insights
The Query Insights feature makes ClickHouse's built-in query log easier to use through various visualizations and tables. ClickHouse's system.query_log table is a key source of information for query optimization, debugging, and monitoring overall cluster health and performance.
Query Overview
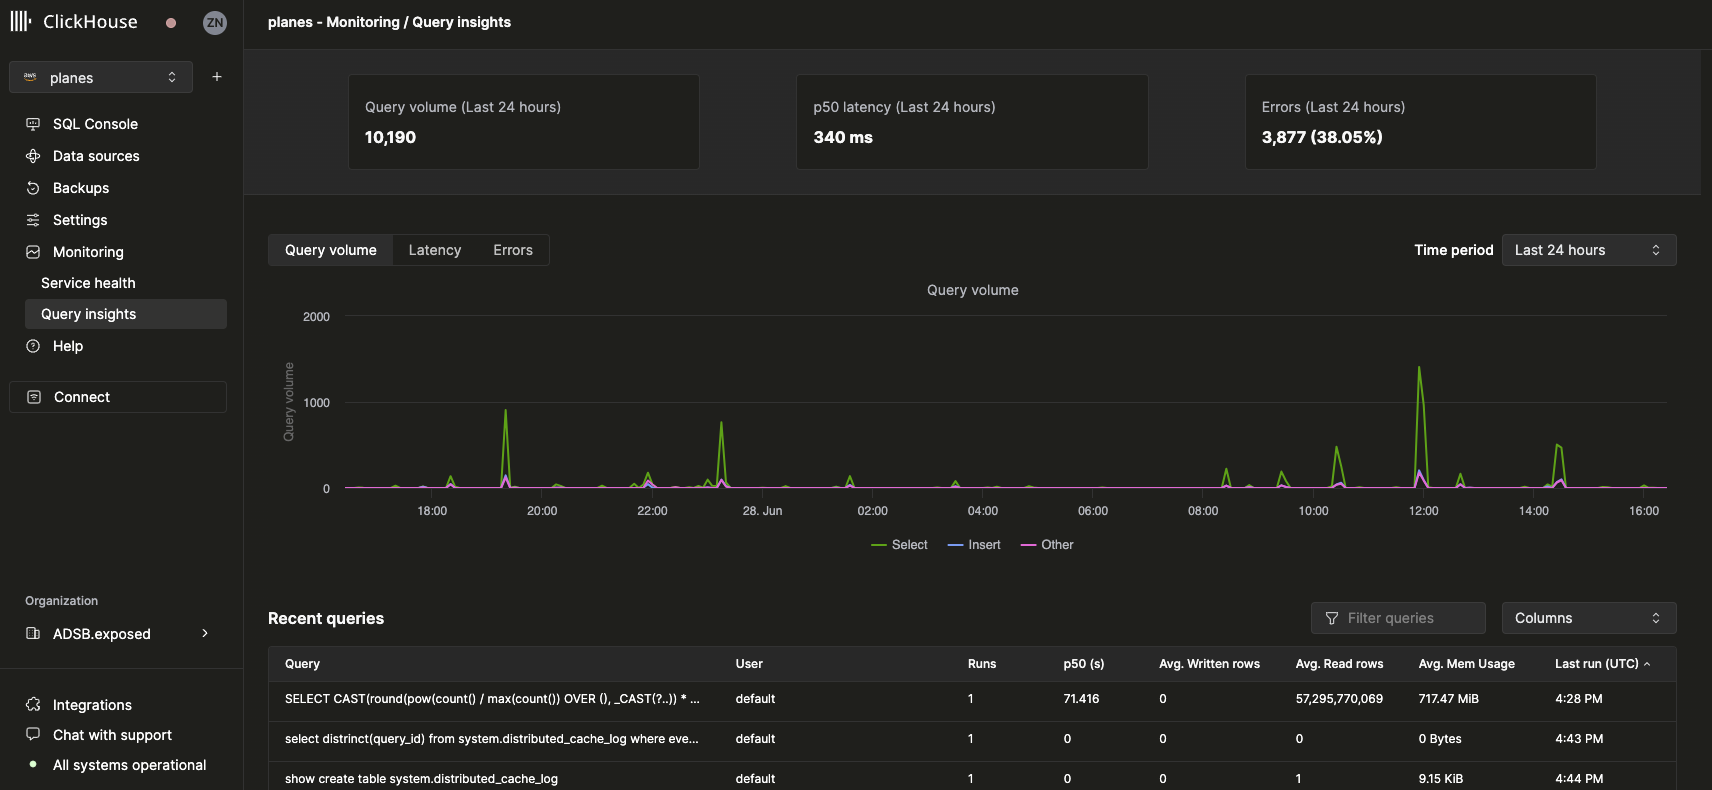
After selecting a service, the Monitoring navigation item in the left sidebar should expand to reveal a new Query insights sub-item. Clicking on this option opens the new Query insights page:

Top-level metrics
The stat boxes at the top represent some basic top-level query metrics over the selected period of time. Beneath it, we’ve exposed three time-series charts representing query volume, latency, and error rate broken down by query kind (select, insert, other) over a selected time window. The latency chart can be further adjusted to display p50, p90, and p99 latencies:

Recent queries
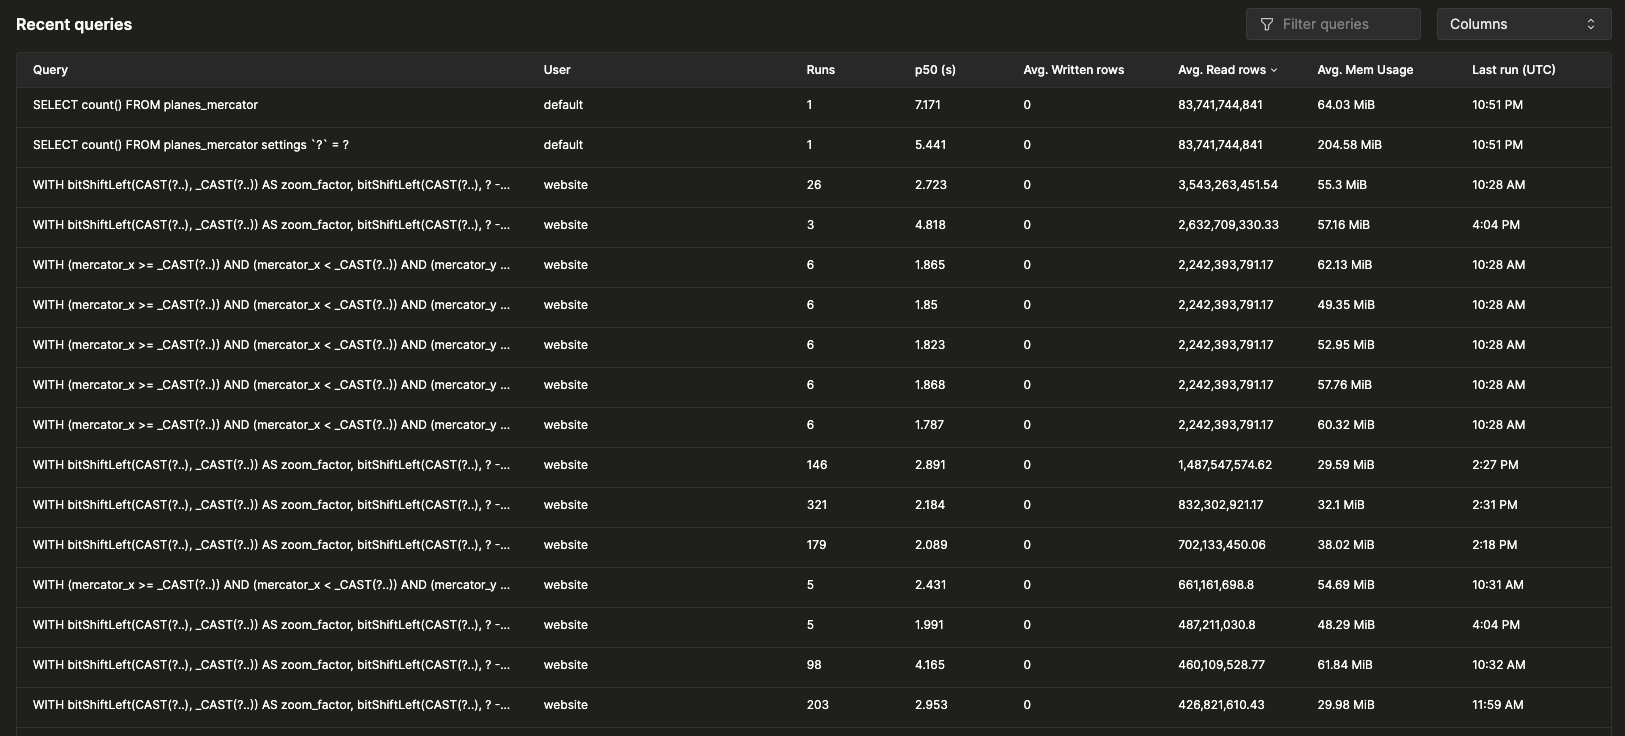
Beneath the top-level metrics, a table displays query log entries (grouped by normalized query hash and user) over the selected time window:

Recent queries can be filtered and sorted by any available field. The table can also be configured to display orhide additional fields such as tables, p90, and p99 latencies.
Query drill-down
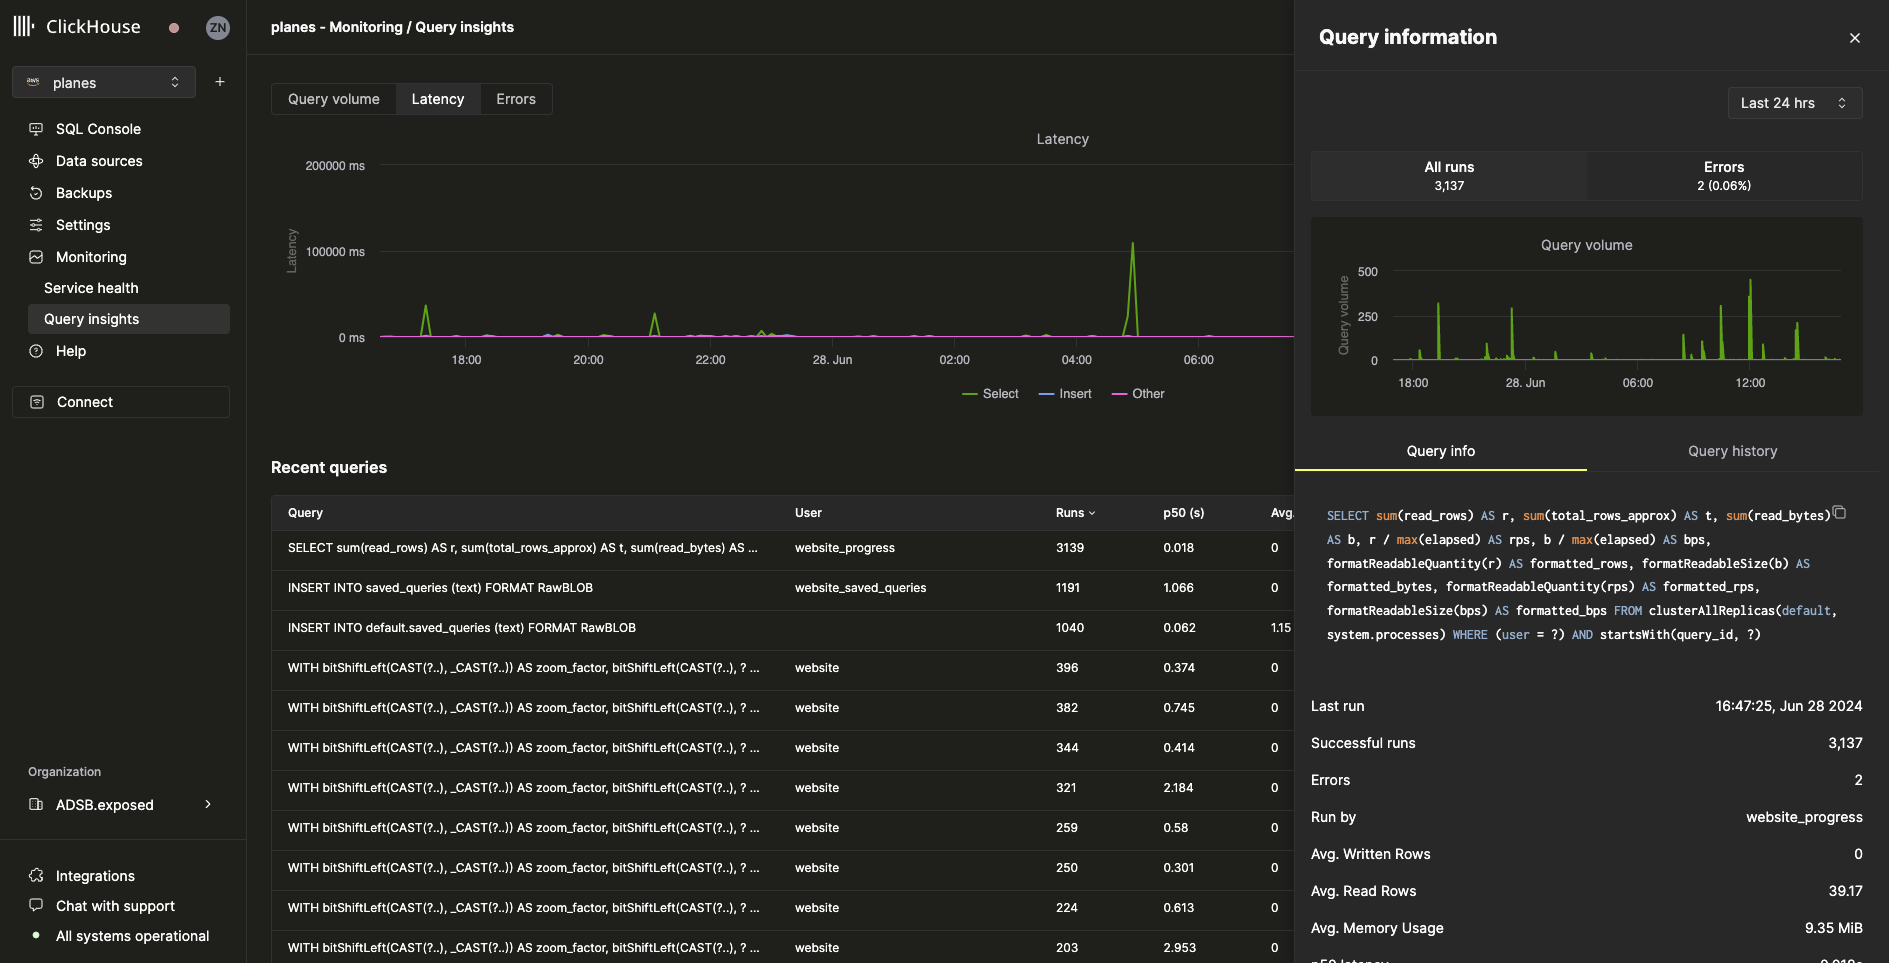
Selecting a query from the recent queries table will open a flyout containing metrics and information specific to the selected query:

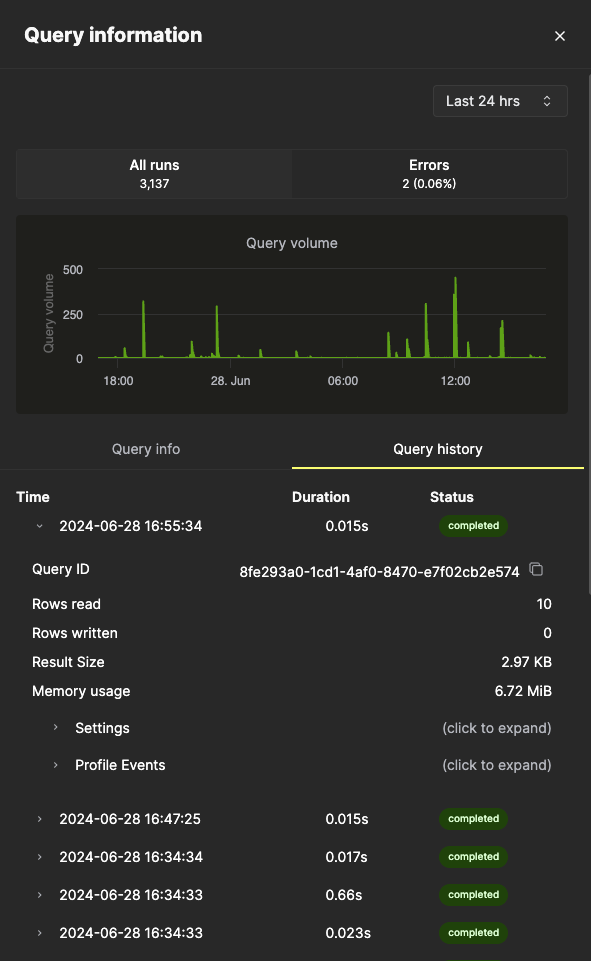
As we can see from the flyout, this particular query has been run more than 3000 times in the last 24 hours. All metrics in the Query info tab are aggregated metrics, but we can also view metrics from individual runs by selecting the Query history tab:

From this pane, the Settings and Profile Events items for each query run can be expanded to reveal additional information.